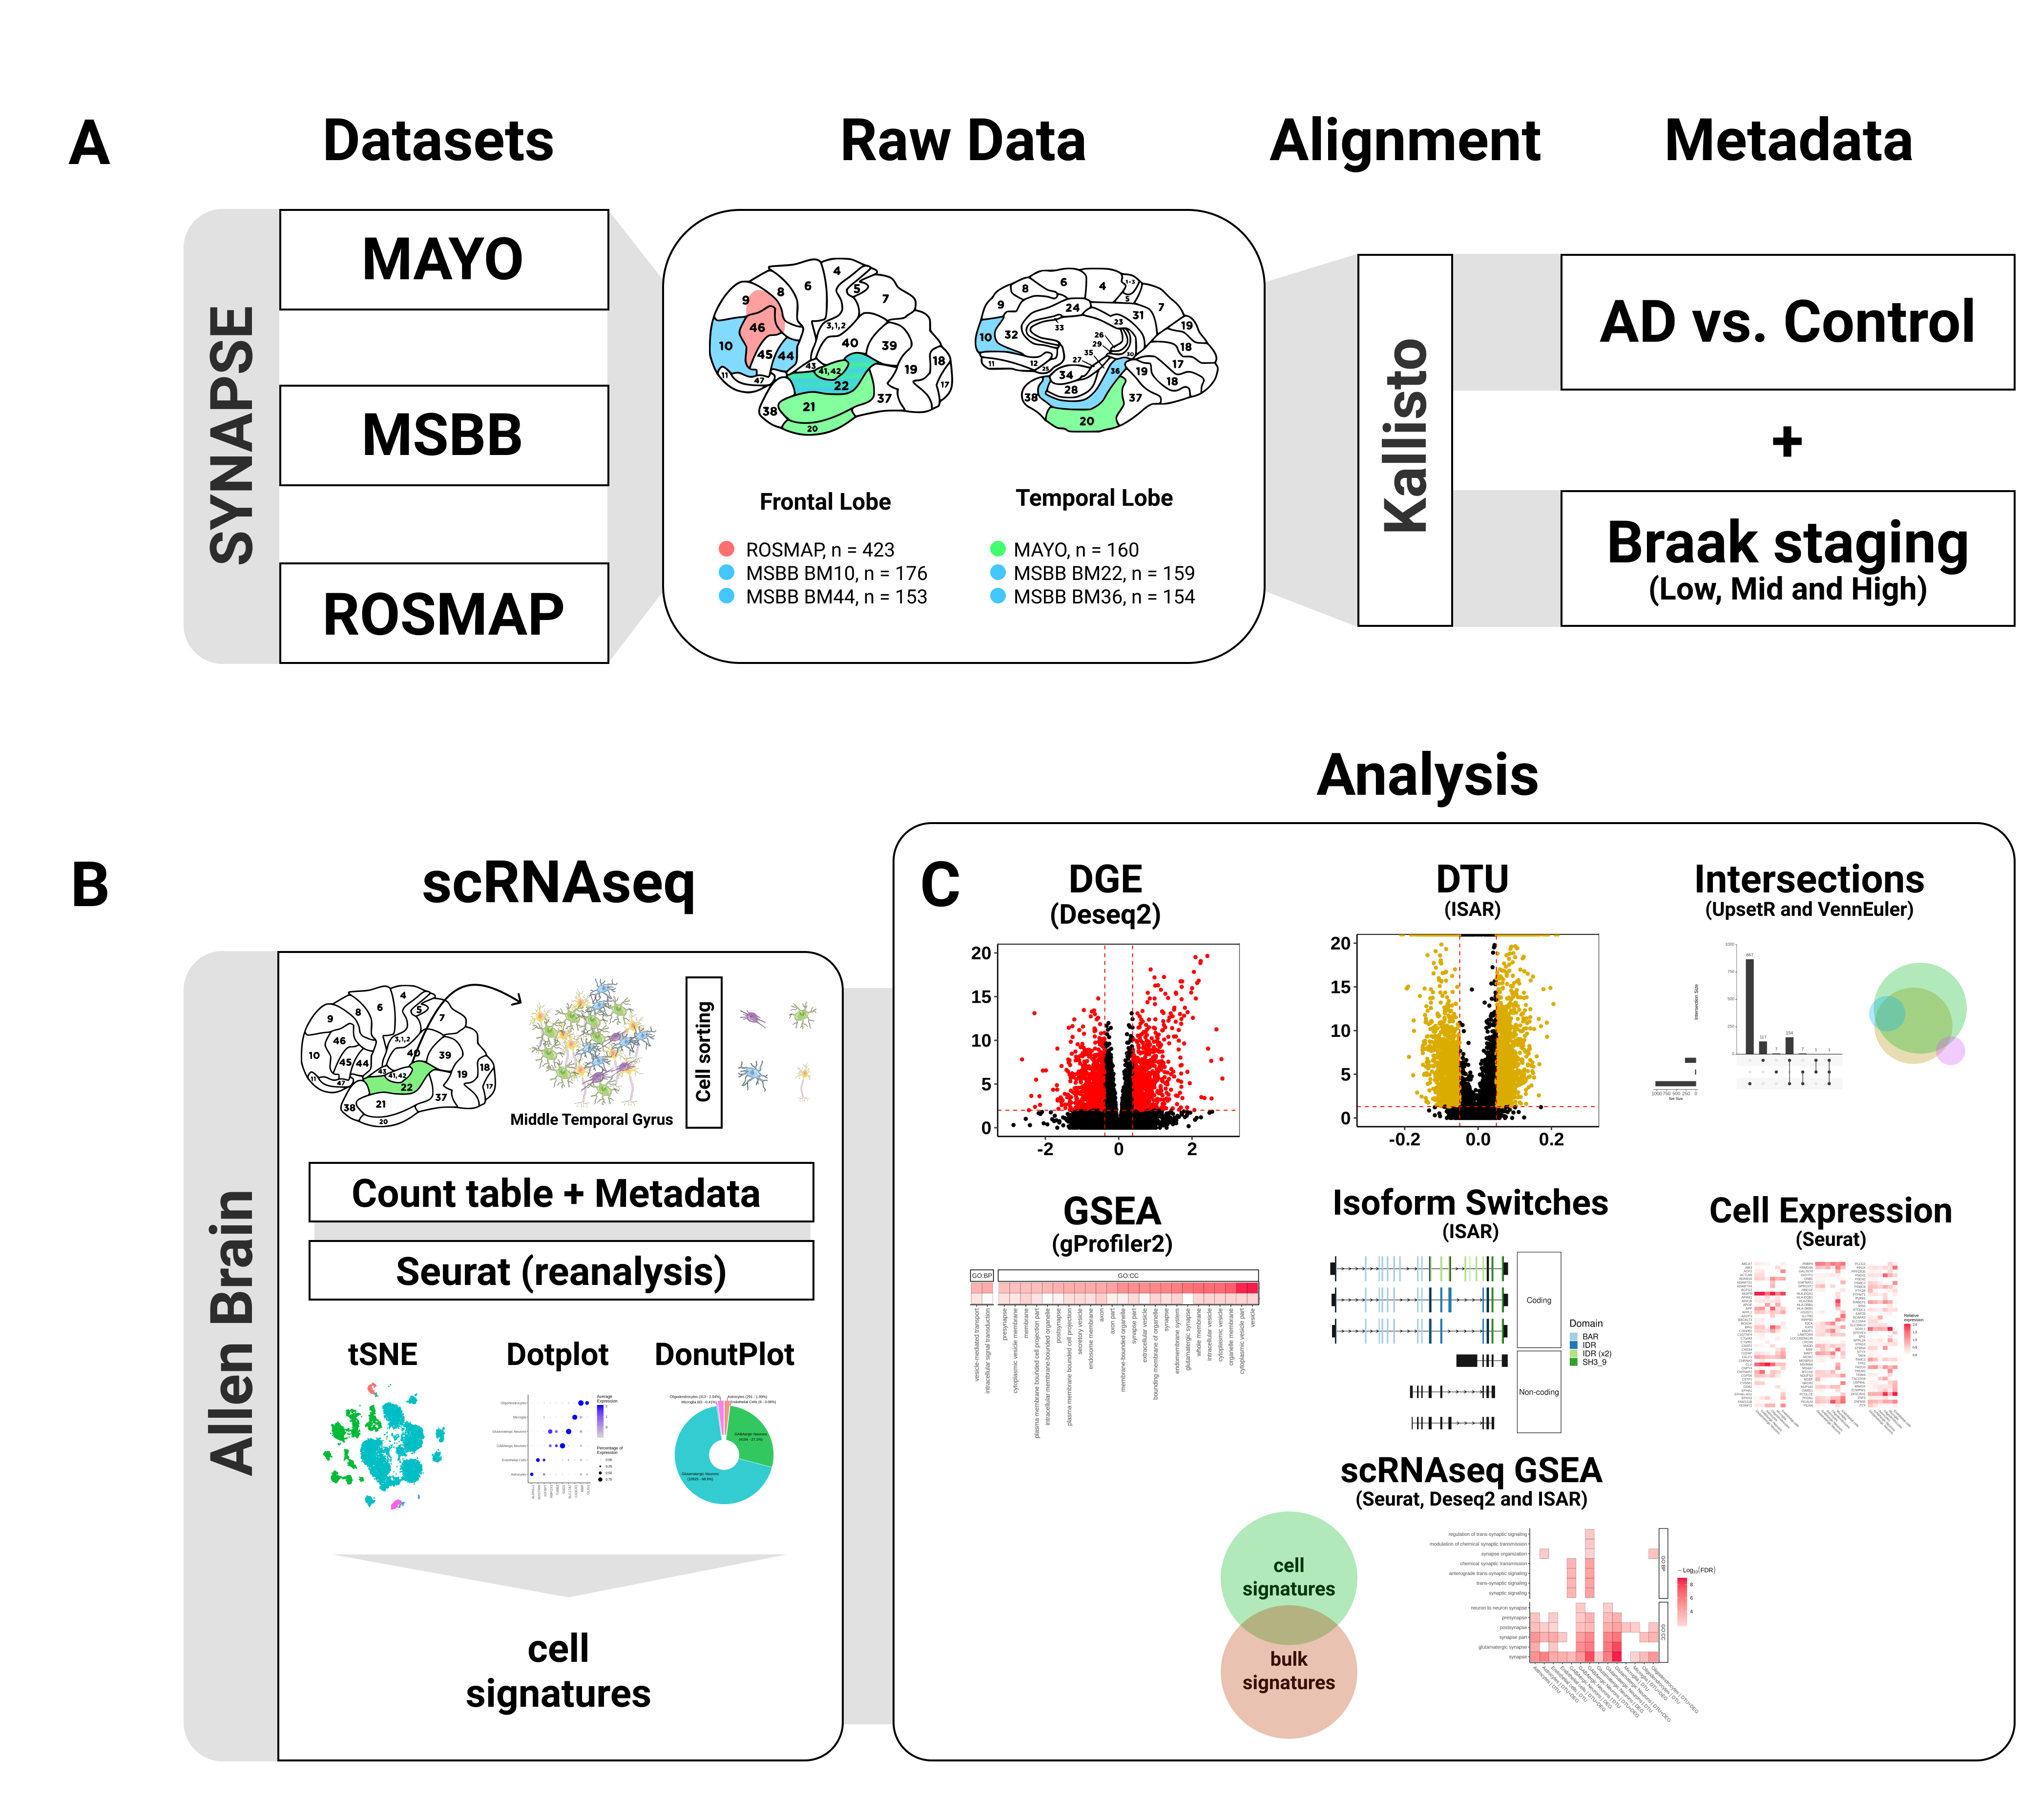
Datasets
RNAseq datasets obtained from different brain regions:
- Mayo: Allen et al, 2016
- MSBB: Wang et al, 2018
- ROSMAP: De Jager et al, 2018
Differentially expressed genes
Differentially expressed genes (DEGs) were identified using differential gene expression at transcript-level using DESeq2 R library (Love et al., 2014, 2019). We selected all genes with False Discovery Rate (FDR) < 0.01 and Fold Change (FC) > 1.3.
Differential transcript usage
Differential Transcript Usage (DTU) analysis was performed using the R library IsoformSwitchAnalyzeR (Vitting-Seerup & Sandelin, 2019) and stageR (Van den Berge et al., 2017) to generate isoforms overall false discovery rate (OFDR). We selected all isoforms with OFDR < 0.01 and dIF (difference in isoform fraction) > 0.05.
Datatable and Heatmap
To facilitate our data visualization, we selected only genes that have at least one DEG and/or DTU . After that, we made heatmaps with DEG and/or DTU for each gene. Non-DEG or Non-DTU were represented in blank. For more information, visit our publication supplementary tables.